Introduction: direct mail ROI has to survive the budget meeting
Direct mail is easy to like and hard to defend if the reporting is soft.
A CRO may remember the prospect who mentioned the handwritten note on a call. Demand gen may point to QR scans. Sales may say the mailer helped them break into an account that had ignored every email.
Those are useful signals. They are not a budget case.
For B2B teams, direct mail ROI needs to answer harder questions:
- What did each delivered send cost after production, postage, data, tooling, and labor?
- Did mailed accounts convert at a higher rate than comparable unmailed accounts?
- How many incremental opportunities, customers, or renewals did the campaign create?
- Did the campaign produce enough gross profit to justify the spend?
- What happened to CAC and payback when direct mail was added to the motion?
This guide gives finance, RevOps, demand gen, and sales leaders a practical way to calculate direct mail ROI without pretending attribution is perfect. The real job is specific: build a model you can use before a campaign launches and defend after the results come in.
The direct mail ROI model in one sentence
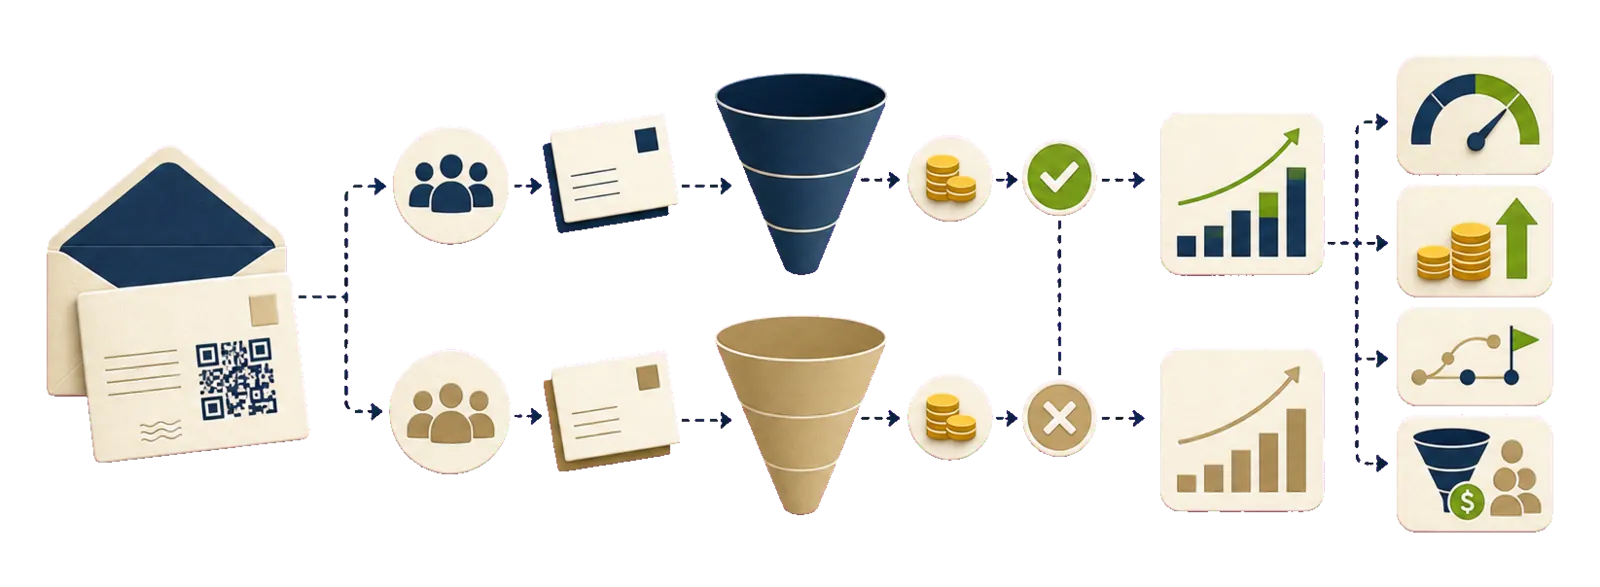
Direct mail ROI = incremental gross profit created / all-in campaign cost.
That sentence matters because it forces two disciplines:
- Count the full cost of the campaign, not just print and postage.
- Measure incremental business impact, not every opportunity that happened to receive mail.
You can still report response rates, scans, meetings, and pipeline. Those are useful diagnostic metrics. But the ROI decision should be based on incremental outcomes and gross profit whenever possible.
If you are still building the mechanics behind QR codes, redirects, CRM logging, and matchbacks, start with the direct mail tracking stack. If you need the broader measurement framework, pair this model with direct mail attribution for B2B.
Start by choosing the ROI lens
Direct mail can support several B2B motions. The math is similar, but the primary outcome changes.
Outbound and ABM: pipeline-first ROI
Use this lens when direct mail is part of sales outreach or account-based marketing.
Primary outcomes:
- meetings booked
- opportunities created
- opportunities advanced
- closed-won revenue from target accounts
This model works best when the campaign has a defined target-account list, clear send dates, a consistent follow-up motion, and CRM fields that separate test and control accounts.
For a campaign design companion, see direct mail for sales outreach.
Customer programs: retention and expansion ROI
Use this lens when direct mail supports renewals, winback, adoption, executive sponsor engagement, or expansion.
Primary outcomes:
- renewal saves
- churn reduction
- expansion opportunities
- account reactivation
- stakeholder engagement during risk windows
Customer ROI is often measured over longer windows because the economic event may be tied to renewal timing. The B2B retention direct mail playbook covers the trigger strategy; this article covers the measurement model.
Formula table: the metrics to put in your model
Do not make finance reverse-engineer your definitions. Put the formulas in the worksheet and keep them consistent across campaigns.
| Metric | Formula | Use it for | Watch out for |
|---|---|---|---|
| Cost per delivered send | all-in campaign cost / delivered pieces | Unit economics by format, segment, or campaign | Use delivered pieces, not uploaded contacts. Remove suppressions, duplicates, and failed deliveries. |
| Test conversion rate | test outcomes / test group size | Mailed-account performance | Define the outcome before launch: meeting, opportunity, win, renewal, expansion. |
| Control conversion rate | control outcomes / control group size | Baseline performance | Control group should be comparable and treated the same except for mail. |
| Lift | test conversion rate - control conversion rate | Incremental conversion impact | Small groups can create noisy lift. Add confidence notes. |
| Incremental opportunities | eligible mailed accounts x opportunity-rate lift | Pipeline creation | Use account-level math for ABM when multiple contacts receive mail. |
| Incremental wins | incremental opportunities x win rate | Customer acquisition impact | Prefer observed win rate once the sales cycle matures; use conservative assumptions before then. |
| Incremental revenue | incremental wins x ACV | Revenue created | Revenue ROI can overstate value for low-margin businesses. |
| Incremental gross profit | incremental revenue x gross margin | Finance-grade ROI | Use contribution margin if finance prefers it. |
| Revenue ROI | (incremental revenue - campaign cost) / campaign cost | Top-line view | Useful, but less conservative than gross-profit ROI. |
| Gross-profit ROI | (incremental gross profit - campaign cost) / campaign cost | Budget justification | Best default for finance conversations. |
| Incremental CAC | campaign cost / incremental wins | Acquisition efficiency | Only meaningful if incremental wins are measured or conservatively estimated. |
| Payback period | campaign cost / monthly gross profit from incremental wins | Cash recovery timing | Add sales-cycle delay separately so payback is not artificially fast. |
Two definitions should be non-negotiable:
- All-in campaign cost includes creative, production, postage, data, tooling, and labor.
- Incremental outcomes are the difference between the mailed group and a comparable baseline, ideally a holdout group.
Step 1: build the cost model first
Direct mail ROI breaks when cost is undercounted. A campaign that looks profitable on print and postage alone may look very different once data work, address validation, sales ops, and reporting are included.
Your all-in cost model should include:
- creative: copy, design, offer development, compliance review
- production: print, handwriting, cards, letters, envelopes, inserts, packaging
- postage or shipping
- data: address capture, enrichment, validation, suppression, deduplication
- tooling: direct mail platform fees, automation tools, QR or redirect tooling
- operations labor: QA, approvals, list preparation, fulfillment checks, reporting
Then convert the total into a unit metric:
Cost per delivered send = all-in campaign cost / successfully delivered pieces
This matters because B2B mailing lists usually contain friction: missing addresses, old offices, duplicates, invalid contacts, suppressed accounts, and contacts who should not receive a campaign. If you divide by uploaded contacts, you make the unit economics look cleaner than they are.
For deeper cost categories, use the breakdown of direct mail marketing costs. For list quality, make address validation, suppression, and deduplication part of the campaign setup rather than a cleanup task after reporting starts.
Step 2: define the measurement window before launch
Direct mail rarely creates instant revenue in B2B. A CFO may receive a note, mention it to a VP, respond to a later email, join a sales call three weeks later, and close six months after that.
That does not make the channel unmeasurable. It means the window must match the motion.
Use a default window by campaign type:
| Motion | Leading indicators | ROI window |
|---|---|---|
| SDR outbound | replies, meetings, opportunities | 60-180 days |
| ABM expansion into target accounts | engaged contacts, meetings, opportunity creation | 90-180 days |
| Event follow-up | post-event meetings, influenced opportunities | 30-120 days |
| Renewal risk | stakeholder replies, saved renewals | renewal window plus 30-60 days |
| Expansion or upsell | expansion opportunities, closed-won expansion | 90-180 days |
The exact window should come from your sales cycle and renewal cycle, not from when the dashboard looks best. Changing the measurement window after seeing results is one of the easiest ways to manufacture ROI.
Step 3: separate observed performance from incrementality
The most common direct mail ROI mistake is treating all mailed-account pipeline as direct mail impact.
Example:
- You mail 200 target accounts.
- 10 become opportunities.
- The campaign dashboard shows $240,000 in potential pipeline.
That does not mean direct mail created 10 opportunities or $240,000 in pipeline. Some of those accounts may have converted anyway because sales was already working them, because they had intent, or because another campaign created demand.
The question is:
How many more accounts converted because mail was added?
That is incrementality.
The cleanest way to estimate it is a holdout test.
Simple holdout design
- Define the eligible audience before launch.
- Randomly split comparable accounts into test and control.
- Send mail only to the test group.
- Keep email, calling, ads, and sales treatment as consistent as possible.
- Measure the same outcome over the same window.
- Calculate lift as
test conversion rate - control conversion rate.
This does not make attribution perfect. It makes the estimate more honest than last-touch reporting or anecdotal recall.
When holdouts are worth it
Run a holdout when:
- the campaign has enough volume for a meaningful comparison
- you are making a budget decision
- you are comparing formats, segments, or offers
- you need to defend spend to finance or leadership
Use a lighter model when:
- the target list is tiny
- the campaign is a relationship touch for strategic accounts
- the primary goal is executive access, not scalable demand creation
- withholding mail from a control group would create unacceptable commercial risk
For tiny Tier 1 plays, use cohort matchbacks and document the limitation. Once the motion scales, introduce holdouts.
Step 4: calculate revenue, gross-profit ROI, CAC, and payback
Once you have cost and incremental lift, the rest of the model is straightforward.
Revenue ROI
Revenue ROI answers: how much incremental revenue did the campaign create relative to cost?
Formula:
(incremental revenue - campaign cost) / campaign cost
This is useful for demand gen reporting, but it can overstate economic value because revenue is not profit.
Gross-profit ROI
Gross-profit ROI answers: how much incremental gross profit did the campaign create relative to cost?
Formula:
(incremental gross profit - campaign cost) / campaign cost
This should be your default finance-facing ROI metric. If your finance team uses contribution margin instead of gross margin, use that.
Incremental CAC
Incremental CAC answers: how much did the campaign spend for each incremental customer?
Formula:
campaign cost / incremental wins
This is especially useful when direct mail is added to an existing outbound motion. The question is not whether direct mail generated a customer in isolation. The question is whether adding direct mail lowered, maintained, or worsened acquisition efficiency for the target segment.
Payback
Payback answers: how long it takes gross profit from incremental customers to recover campaign spend.
Formula:
campaign cost / monthly gross profit from incremental wins
For B2B, report two payback views:
- economic payback after close: time from closed-won to recovering spend
- cash-timing payback: sales-cycle delay plus economic payback
If a campaign has a 90-day sales cycle and 1.5 months of post-close payback, the cash-timing payback is closer to 4.5 months from send date.
Worked example: Tier 1 outbound campaign
Imagine a Tier 1 outbound campaign aimed at finance leaders in target accounts.
Campaign inputs:
| Input | Value |
|---|---|
| Eligible accounts | 400 |
| Test group mailed | 200 |
| Control group | 200 |
| Delivered pieces | 200 |
| Cost per delivered send | $7.50 |
| All-in campaign cost | $1,500 |
| Measurement window | 60 days |
| ACV | $24,000 |
| Gross margin | 75% |
| Expected sales cycle from send | 90 days |
Observed outcomes after 60 days:
| Outcome | Test | Control |
|---|---|---|
| Opportunities created | 10 | 6 |
| Opportunity rate | 5.0% | 3.0% |
| Lift | 2.0 percentage points |
Incremental opportunity math:
| Metric | Calculation | Result |
|---|---|---|
| Opportunity-rate lift | 5.0% - 3.0% | 2.0% |
| Incremental opportunities | 200 x 2.0% | 4 |
| Assumed win rate | 25% | |
| Incremental wins | 4 x 25% | 1 |
| Incremental revenue | 1 x $24,000 | $24,000 |
| Incremental gross profit | $24,000 x 75% | $18,000 |
ROI, CAC, and payback:
| Metric | Calculation | Result |
|---|---|---|
| Revenue ROI | ($24,000 - $1,500) / $1,500 | 15.0x |
| Gross-profit ROI | ($18,000 - $1,500) / $1,500 | 11.0x |
| Incremental CAC | $1,500 / 1 | $1,500 |
| Monthly gross profit from win | $18,000 / 12 | $1,500 |
| Economic payback after close | $1,500 / $1,500 | 1 month |
| Cash-timing payback from send | 90-day sales cycle + 1 month | about 4 months |
This is a strong result, but it should still be reported carefully:
- The opportunity lift is based on 200 mailed accounts and 200 control accounts, so confidence may be limited.
- The win is modeled from opportunity lift and assumed win rate, not fully observed closed-won data.
- The 60-day window may capture opportunity creation but not final revenue.
- If the campaign targeted accounts already receiving above-average sales attention, the holdout must receive similar treatment.
That last section is not a footnote. It is what makes the model credible.
Sensitivity analysis: test the two variables that can fool you
Direct mail ROI models are usually most sensitive to two assumptions:
- incremental opportunity lift
- win rate
Keep the base case visible, then show a conservative and upside case. Here is the same campaign with ACV, margin, and cost held constant.
| Scenario | Opportunity lift | Incremental opportunities | Win rate | Incremental wins | Gross profit | Gross-profit ROI | Incremental CAC |
|---|---|---|---|---|---|---|---|
| Conservative | 1.0% | 2 | 20% | 0.4 | $7,200 | 3.8x | $3,750 |
| Base | 2.0% | 4 | 25% | 1.0 | $18,000 | 11.0x | $1,500 |
| Upside | 3.0% | 6 | 30% | 1.8 | $32,400 | 20.6x | $833 |
Read this table like a budget owner:
- If the campaign only works in the upside case, do not scale yet.
- If the conservative case still clears your CAC and payback thresholds, the case is stronger.
- If ROI is highly sensitive to win rate, wait for more mature pipeline before declaring success.
- If lift is uncertain, run the next campaign with a larger holdout or a longer measurement window.
Sensitivity analysis is not busywork. It prevents a good-looking spreadsheet from hiding a fragile channel.
Worksheet structure: what to build in the spreadsheet
A useful direct mail ROI worksheet should be boring, explicit, and easy to audit. Build it as a small model with separate tabs instead of one giant sheet.
Tab 1: campaign setup
Fields:
mail_campaign_id- campaign name
- motion: outbound, ABM, event, renewal, expansion, winback
- segment or tier
- target persona
- offer or CTA
- send date
- measurement window start and end
- primary outcome
- secondary outcomes
- test/control assignment method
- notes on exclusions or suppressions
Purpose: make every campaign report traceable back to a defined business question.
Tab 2: cost inputs
Fields:
- creative cost
- production cost
- postage or shipping cost
- data enrichment and validation cost
- tooling cost
- estimated ops hours
- hourly cost assumption
- total all-in cost
- uploaded contacts
- suppressed contacts
- failed or undeliverable pieces
- delivered pieces
- cost per delivered send
Purpose: stop unit economics from being understated.
Tab 3: audience and holdout
Fields:
- eligible account count
- eligible contact count
- randomization method
- test group size
- control group size
- account tier
- industry
- region
- sales owner
- pre-existing opportunity flag
- pre-existing intent flag
Purpose: check whether the test and control groups are comparable enough to support a lift estimate.
Tab 4: outcomes
Fields:
- replies
- QR or short URL visits
- meetings booked
- opportunities created
- opportunities advanced
- closed-won deals
- renewal saves
- expansion revenue
- test conversion rate
- control conversion rate
- lift
- incremental opportunities
- incremental wins
- incremental revenue
- incremental gross profit
Purpose: separate diagnostic engagement from economic outcomes.
Tab 5: decision outputs
Fields:
- revenue ROI
- gross-profit ROI
- incremental CAC
- economic payback
- cash-timing payback
- conservative/base/upside sensitivity
- confidence note
- recommendation: stop, repeat, scale, or retest
Purpose: turn measurement into a decision.
The final row should be written in plain English: "Scale this campaign to Tier 2 CFO accounts only if the next test keeps gross-profit ROI above 3x and payback below six months." That is more useful than a dashboard full of unlabeled percentages.
Reporting confidence without overstating causality
Good measurement is not the same as false precision. Direct mail teams should be clear about what the data can and cannot prove.
Sample size
Small groups create unstable lift. If 2 extra accounts convert in a 50-account test, the percentage lift can look dramatic while the confidence is weak.
When volume is small:
- report ranges, not a single heroic number
- label the result as directional
- avoid declaring a format or offer "proven"
- aggregate learning across similar campaigns when the audience is comparable
Sales-cycle windows
Opportunity creation may appear in 30-90 days. Closed-won revenue may take much longer.
Report both:
- leading ROI indicators: meetings, opportunities, stage movement
- mature ROI indicators: wins, revenue, gross profit, payback
Do not force a short-window campaign to prove long-cycle revenue before the sales cycle has had time to play out.
Underpowered holdouts
A holdout is not automatically valid because it exists. A 20-account control group can be useful for directional learning, but it is not a strong basis for a major budget decision.
Use underpowered holdouts to identify signal. Use larger tests to justify scale.
Unequal treatment
If the test group receives more sales attention than the control group, the measured lift may reflect sales effort, not mail.
This is common in ABM. The practical fix is to document the full treatment:
- mail sent
- email sequence
- call sequence
- ads
- event invites
- sales-owner actions
Then make test and control treatment as consistent as possible except for the mail.
Attribution vs causality
QR scans, PURLs, and CRM activities show engagement and help connect records. They do not prove causality by themselves.
Holdouts improve causal confidence, but even then you are estimating lift in a real commercial system, not running a lab experiment. Say that plainly. Leaders trust a model more when it admits its limits.
Common ROI traps
Trap 1: "We got QR scans, so ROI is positive"
QR scans are response signals. They can help diagnose creative and offer quality, but ROI comes from incremental pipeline, revenue, retention, or expansion.
Trap 2: reporting influenced pipeline as ROI
Influenced pipeline can be useful for understanding reach, but it should not be presented as direct mail ROI. Keep influenced pipeline separate from incremental pipeline.
Trap 3: changing list, offer, format, and follow-up at once
If every variable changes, you cannot tell what worked. When possible, isolate one major variable per test: segment, format, offer, or timing.
For format decisions, keep the unit economics tied to the job: a lower-cost printed piece may be right for a broad event follow-up, while a handwritten note may justify its higher cost only for a tighter segment with higher ACV or relationship value.
Trap 4: using contact-level math for account-level buying
B2B purchases happen at accounts. If three contacts at one account receive mail and one opportunity is created, do not count that as three independent conversion chances. For ABM, account-level reporting is usually cleaner.
Trap 5: ignoring address quality
Bad addresses do not just waste postage. They distort ROI by inflating uploaded volume and reducing delivered reach. Clean the list before the campaign and report cost per delivered send after it.
A practical decision rule for scaling direct mail
Before the campaign launches, agree on the decision rule.
Example:
We will repeat this campaign if the base case shows at least 3x gross-profit ROI, incremental CAC below our Tier 1 outbound benchmark, and cash-timing payback under six months. We will scale only if the next test confirms lift with a larger holdout.
That type of rule keeps the post-campaign conversation focused. Instead of arguing about whether the campaign "felt" successful, the team can decide whether the results cleared the agreed threshold.
For multi-touch programs, the threshold may not be "mail alone generated customers." It may be "adding mail to the existing sequence created enough incremental lift to justify the marginal cost."
That is the right question.
Conclusion: the best ROI model is conservative enough to use
You do not need perfect attribution to make smart direct mail decisions.
You need:
- full cost accounting
- clean campaign IDs
- consistent measurement windows
- test/control reporting where volume allows
- gross-profit ROI, CAC, and payback
- confidence notes that explain what the data can and cannot prove
Direct mail earns a durable B2B budget when it is treated like a measured growth channel, not a creative side project.
Want a defensible model before you scale spend? Book a direct mail ROI worksheet and measurement consult and we'll help audit your campaign assumptions, tracking plan, holdout design, and ROI model.